Data Insights
Analytics that goes beyond the dashboard — from what happened, to why, to what's next, to what to do about it. Built for the people making the decision, not just the people who built the pipeline.
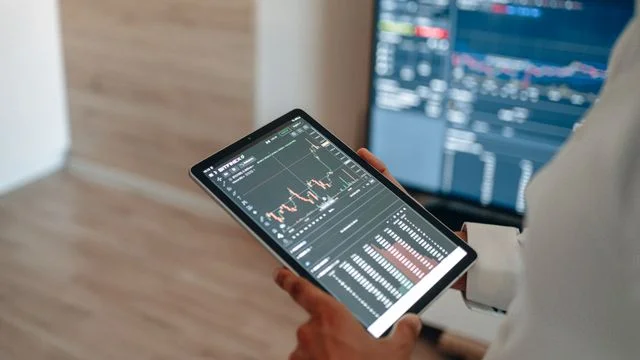
Four layers, one continuous line of sight
What's happening
Live dashboards built around the metrics each team actually acts on — not a generic BI template. Numbers update the moment reality changes, so nobody's making a decision off last week's snapshot.
Why it's happening
AI-generated narrative explanations trace a shift back to its root cause automatically — a regional dip, a churn spike, a margin squeeze — explained in plain language, with the confidence behind the explanation, not just a chart that raises more questions than it answers.
What's likely next
Forecasting models trained on your governed data flag what's coming — a demand surge, a customer about to churn, a cash flow gap — early enough to still change the outcome, not just report on it after the fact.
What to do about it
The newest layer: instead of stopping at a forecast, the system recommends — and where you allow it, initiates — the next best action, with a confidence score attached, so a recommendation is never a black box.
Why analytics is moving past the dashboard
Faster decisions, not just faster reports
Skip the week-long wait for an analyst to pull a one-off query — ask a plain-language question and act on the answer the same day.
Self-serve for everyone
Conversational analytics means any team member can ask "why did CAC increase last quarter?" and get a grounded, root-cause answer — no SQL, no ticket to the data team.
Proactive, not reactive
Anomalies and shifts surface the moment they happen, delivered to the person who needs to act — instead of surfacing in a monthly review, three weeks too late to matter.
From forecast to action
Prescriptive recommendations close the loop between knowing and doing — the system doesn't just tell you demand is rising, it suggests the reorder, sized and ready for approval.
Numbers people — and AI — trust
One shared definition of every metric across dashboards, reports, and AI-generated summaries, so two teams — or a person and an AI agent — never argue over whose number is right.
Governed AI reasoning
Every AI-generated explanation or recommendation is traceable back to the underlying data and logic that produced it — no black-box answers your team can't defend in a leadership meeting.
Reports and insights teams actually open
Executive KPI dashboards, self-narrating
One live view of revenue, margin, and growth — with an AI-written summary of what changed and why waiting at the top, before anyone has to dig through a chart.
Customer churn & retention intelligence
Move past a churn score to a full diagnostic — which customers, why, and a recommended retention action ranked by likelihood of success.
Financial close & variance reporting
Automated variance narratives explain the "why" behind every number, cutting a multi-day close-review process down to hours.
Sales & pipeline performance
Rep-level and territory-level views that update as deals move, with predictive win-probability scoring and next-best-action nudges for reps and managers alike.
Demand forecasting with automated reordering
Predictive models flag a coming demand spike; prescriptive logic drafts the reorder — a human just has to approve it, not build it from scratch.
Conversational, ask-anything analytics
Any team member can type a question in plain English — "which campaigns drove the most qualified leads this month?" — and get an answer grounded in real, governed company data, not a generic guess.
Built on the platforms leading the industry
Microsoft Fabric
Power BI Copilot and Fabric IQ bring natural-language questions and AI-generated narratives directly onto governed OneLake data, while real-time Business Events mean predictive and prescriptive logic can react to a meaningful shift the moment it happens, not on a schedule.
Databricks
Genie answers plain-language questions grounded in real business data, while Genie Ontology keeps every explanation consistent with how your company actually defines its metrics — turning diagnostic and predictive answers into something your team can act on with confidence, not just interpret.
Turn your reports into decisions
Show us a dashboard you don't trust — we'll show you why, and what it looks like once it can explain, predict, and recommend for itself.